
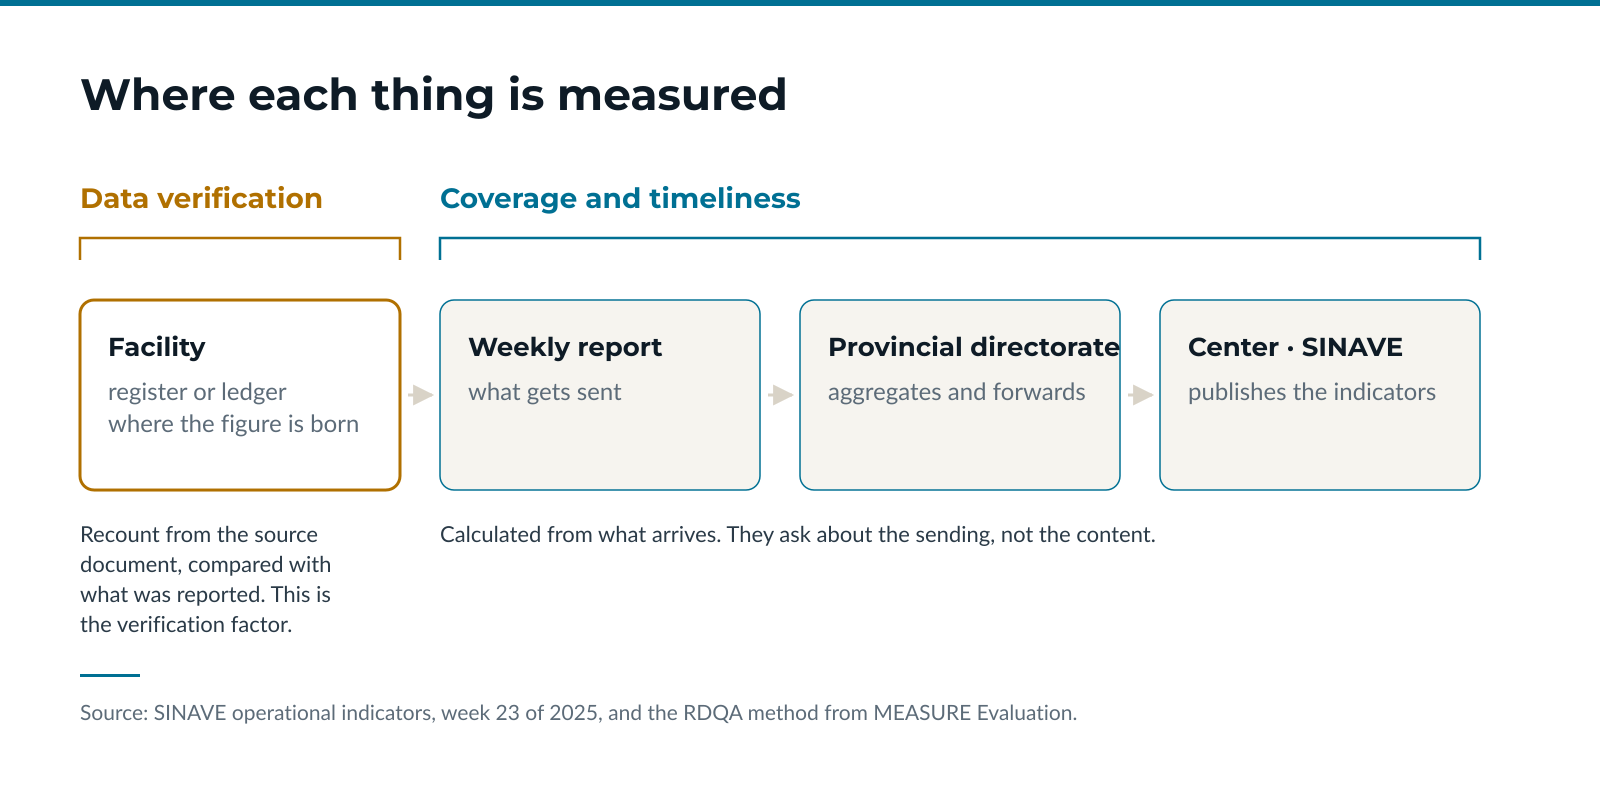
Coverage says how many facilities reported and timeliness says whether they reported within the deadline. In week 23 of 2025 the Dominican Republic published 89% and 87%. Neither figure says whether what was reported matches what is written in the facility register. That check is what a routine data quality assessment does, and it is done at the facility, not at the center.
There is a question that rarely gets asked when a surveillance system is working well: how do we know the numbers it publishes are true.
This is not a suspicion. It is a technical distinction, and in the Dominican Republic it can be posed using the figures the ministry itself publishes every week.
What does SINAVE publish today?
Operational indicators, named and numbered, in the weekly epidemiological bulletin. In epidemiological week 23 of 2025:
- 2,986 facilities at the first, second and third level of care were required to report.
- 2,652 reported, which is 89% coverage.
- Of those that reported, 87% did so within the deadline. That is timeliness.
- All 40 Provincial and Health Area Directorates appear compared against each other, week by week.
That is a national measurement apparatus with a historical series, territorial comparison and regular publication. It is worth saying so before proposing anything: many countries in the region do not have it.
What exactly do those two indicators ask?
Coverage asks whether the report arrived. Timeliness asks whether it arrived on time. Both ask about the sending.
Neither asks about the content. A facility that reports a wrong number, in full and within the deadline, counts toward the 89% and the 87% exactly like one that reported the right number.
This is not a flaw in SINAVE. It is the limit of what can be measured from the center: coverage and timeliness are calculated from what arrives. Verifying the content requires going to the document where the figure was born.
What is a routine data quality assessment?
Known by its initials, RDQA. It is a method published by MEASURE Evaluation and used across programs financed by the Global Fund, PEPFAR and WHO. It has two parts, and the second is forgotten more often than the first.
- Data verification: recount from the source document at the facility, the register or the ledger where the case was written down, and compare it with the figure reported upward. The ratio between reported and recounted is the verification factor. A 1.0 is an exact match.
- Systems assessment: whether there are defined roles, standard forms, any review before sending, and whether the source document is kept and can be consulted again six months later.
The first answers whether the figure is true today. The second answers whether it will still be true next month, which is the question that actually matters to whoever has to decide using those numbers.
Which dimensions go unmeasured today?
Data quality breaks down into several dimensions. Coverage and timeliness cover part of it. The rest are visible only at the facility:
- Accuracy: the reported figure matches the recount from the source document.
- Completeness: within the report that was sent, the fields are filled in.
- Consistency: the same event is counted the same way in two systems that should agree.
- Integrity: the figure was not transformed as it was aggregated from one level to the next.
The distinction between coverage and completeness is the one most often blurred, and the most expensive. A facility can send its report, count toward the 89%, and have left half the fields blank. Coverage measures envelopes delivered; completeness measures what is inside the envelope.
Does Dominican regulation ask for any of this?
It does, and that is the part that tends to surprise. Decree 249-06, which approves the regulation of the health information system, lists among its functions the registration, collection and quality assurance of the primary data. The primary datum is precisely the one in the source document.
So the obligation has existed since 2006. What does not exist is a published method that applies it to the Dominican system and whose results can be compared across provinces, the way coverage and timeliness already are.
What would it take to run one?
Less than it appears, because the hard part is already built. Four decisions:
- Choose two or three indicators, not all of them. The method is designed for a maximum of four at a time, and beyond that it stops being routine.
- Choose a facility sample that includes the first level of care, which is where the data is born and where auditing is rarest.
- Recount from the source document and calculate the verification factor by level, not only nationally. A national average hides exactly what the exercise is looking for.
- Publish the result alongside coverage and timeliness, in the same bulletin. An indicator that lives in a separate report enters no conversation.
What this analysis does not claim
It does not claim Dominican data is poor. Nobody knows publicly, and that is the point: it has not been measured and published.
It does not claim coverage and timeliness are surplus. They are necessary, they are published with discipline, and they are the base on which the rest can be built.
And it evaluates neither SINAVE nor any provincial directorate. The observation is about what the published indicators ask, not about who produces them.
Sources
Weekly epidemiological bulletin of the Dirección General de Epidemiología, week 23 of 2025, the source of the 2,986 facilities, the 89% coverage, the 87% timeliness and the 40 provincial directorates. Routine Data Quality Assessment (RDQA) tool from MEASURE Evaluation, the source of the verification factor and the four indicator limit. Decree 249-06, approving the regulation of the General Health Information System, for the quality assurance of primary data. Regulation 309-07 of the National Epidemiological Surveillance System.
- Data quality
- Epidemiological surveillance
- District-level reporting